Drew Linzer, a political scientist from Emory and the creator of Votamatic the voting and forecasting site, published his model for predicting the two party vote-share of the 2016 election over two years ago. His model, which borrows from Alan Abarmowitz’s forecasting model, incorporates the quarterly GDP growth rate from Q2 of each election year, the net approval rating of the incumbent president at the end of August (Approval – disapproval), a dummy for two terms held by the same party, and the vote share of the party in power. For example in 2008 John McCain’s vote share (46.3%) because he was from the incumbent party, though he was not the incumbent candidate himself. The results of that model in the figure below predict that the Democratic Party has an expected vote share of 50.05% in 2016. So, a tossup. (These data are based on 3000 simulations run in R using a Markov-Chain Monte Carlo simulation).
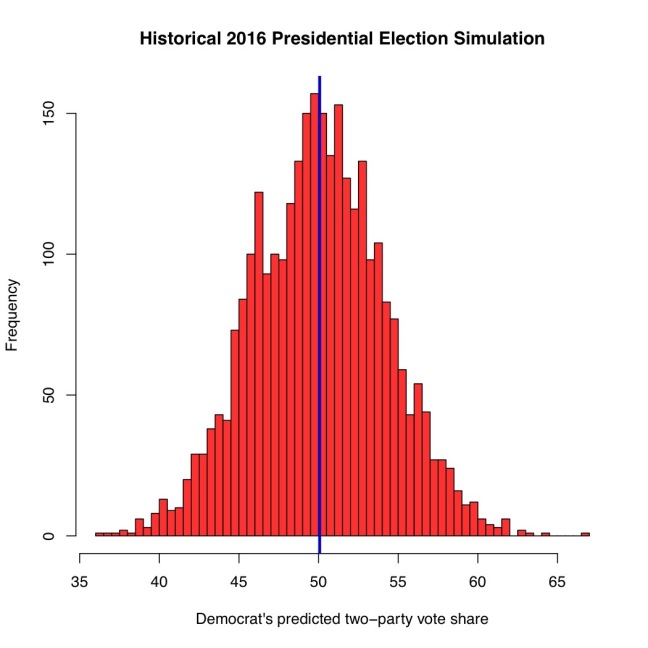
(Blue line represents the median vote share)
Although we don’t know what Obama’s approval rating will be in August of 2016 or what the GDP growth will be in 2016, we can take a few guesses and model those appropriately.
The past few opinion polls have shown President Obama’s approval rise recently, however I’m going to assume that his net approval evens out at 0. I don’t think this is an unreasonable expectation, given the stability in his approval rating, but if the economy were to go south, his approval would likely go with it. Simulations are useful because they allow you to vary your data to see how those variables influence your results. The series of charts below show the role of GDP growth on vote share, when approval is net 0, and the same party has controlled the White House for two consecutive terms. With these assumptions in place, the three graphs below are scary for Democrats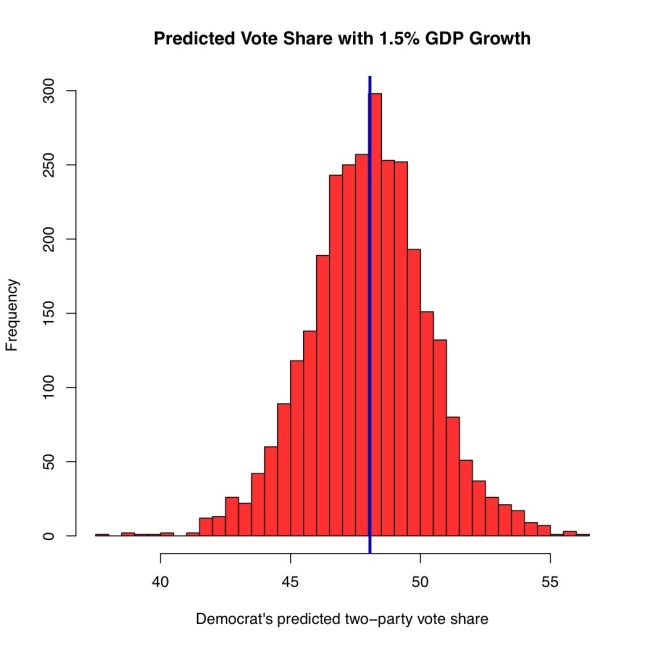
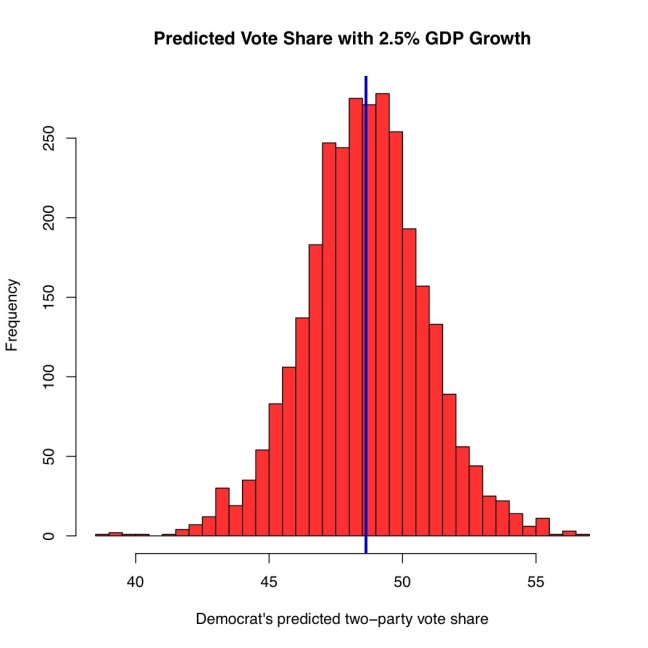
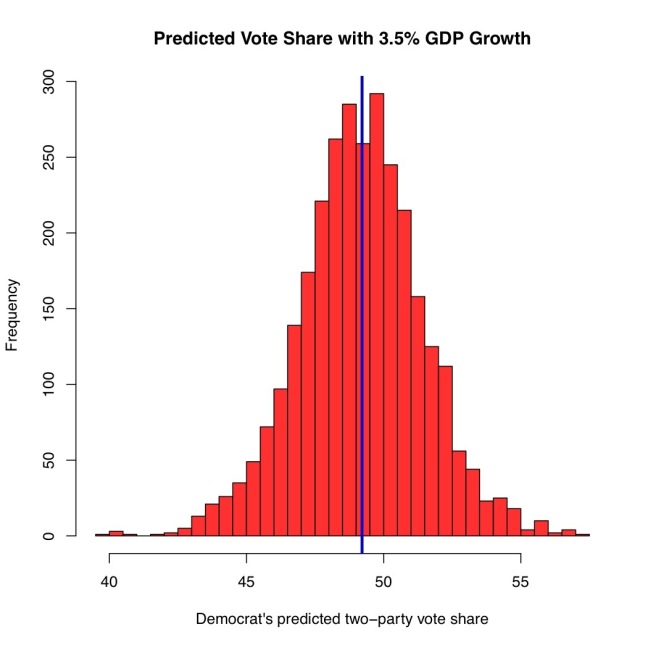
These three charts show that based on historical data there needs to be considerable GDP growth for the incumbent party to hold onto the presidency when that president’s net approval is 0. An important point to reiterate is that by no means are there any causal relationships between GDP Growth or Net Approval Rating on vote share. However, when people approve of the president in power and the economy is doing well, they’re much more likely to support a candidate from that president’s party. When the inverse is true, they often flock to the other party’s candidate, with 2008 serving as the perfect example. The table below shows quarterly GDP growth from FRED during Obama’s second term.
As you can see, 3.5% GDP growth, which still doesn’t get the Democratic candidate to 50%, hasn’t happened during Obama’s second term, though Q4 of 2015 was about 3.9% but it hasn’t been validated by the Fed. Does this mean the Democratic candidate is finished? No absolutely not, but it does suggest that candidates aside, the fundamentals of 2016 point to a very close election, and the beginnings or even rumblings of a recession will stack the deck against the eventual Democratic nominee.
One interpretation of these data is that given the historical precedent, Democrats likely need to select a more moderate or electable candidate than choose someone who’s close to the party base. Given the well established relationship between ideological extremity and decreasing vote share (Canes-Wrone, Brady, and Cogan, 2002) selecting Bernie Sanders likely stacks the deck against Democrats, though a race against Trump, or one that also involves Mayor Bloomberg, certainly throws a monkey wrench into the projections.
The most important point is that I would be cautious to assert that demographics are destiny. Democrats may have an emerging national advantage, but that does not mean that it will be present every year, in the same way that a year that ends up colder than the mean for the 100 year temperature average does not therefore mean that climate change isn’t real. Time series data rarely grow monotonically. Stock indices fluctuate significantly from day to day, but in the long run grow over time. Democrats may have a national advantage but that does not guarantee victory in 2016.
Here’s the data for models.

One thought on “Modeling the 2016 Election”