Guest author: Danny Metcalf
I promised a few weeks ago to update my earlier post about special elections after results from Montana’s at-large race came in. Obviously, I completely missed that window, but now we have a couple more special elections to talk about.
Before I actually get into this project, let’s talk about the elephant in the room, and by “the room,” I mean the congressional office for the representative from Georgia’s 6th district. In a moment, I’m going to talk about how this sequence of special election results is great news for Democrats. That’s going to feel pretty hollow now that Karren Handel (R) won the highest-profile special election of the year (ever?). It seems clear that the way this election result is going to be interpreted in the public consciousness and in Congress, is as a repudiation of claims of Democratic momentum and a sign that Republicans can continue with their policy agenda. There might be real tangible consequences to healthcare, tax reform, and other legislation from an emboldened GOP caucus. There might be strategic consequences by which leaders in both parties rethink where and how campaign dollars are spent. When I write, in a few paragraphs, that Democrats are in a very strong political position, you should understand that I don’t mean anyone should be happy about a loss. On the other hand, just because we all hyped up this race as a binary determinant of the current political climate doesn’t mean that is actually the best way to look at it. The interpretation of the Georgia’s 6th district election might be that Dems have been rebuked, but honestly, that interpretation is dumb.
For discussion of what I’m trying to do with this project, see my earlier post, but I’ll give summarize the idea here and then dive into results.
General congressional elections in the US consist of 435 distinct races happening in different districts at the same time. Since they are occurring at the same time, it is natural to expect some relationship in how two different districts vote. That is, a good Republican year in Missouri will probably be a good Republican year in Nevada, to the extent that national politics relate to district-level results. On the other hand, two districts have totally different populations. A deep red district in rural Alabama will vote more Republican than a deep blue district in Los Angeles, regardless of the national political environment. Finally there is some variation between seats not captured by partisanship or election year. Two equally deep red districts might have meaningfully different results because of candidate level characteristics, campaign spending, other unobserved factors, or sheer dumb luck*. I therefore model election results happening at the same time as the national partisan environment plus district partisanship plus a random error term.
For this project, I am treating 2017 special elections as if they are being produced by a general election happening at the same time and predicting what the rest of the country would look like in that hypothetical election**. The previous post discussed sampling results using election returns from the GA-06 first round and the KS-04 election. Results here will include KS-04, the GA-06 second round, the Montana-at large race, and the SC-05 race. Note that Republican candidates won the KS-04 and MT-AL races fairly comfortably and the GA-06 and SC-05 races more narrowly. It is completely fair to say that those represent good results for Republicans because the actual, real-world consequences are that more Republicans are in Congress. That said, all four of these races are in districts that Republicans should expect to win in a neutral year. The Kansas, Montana, and South Carolina districts only become competitive in national politics in Democrats’ wildest pipe dreams and Republicans’ darkest nightmares. The Georgia seat is a little different. PVI, the method I use to measure partisanship, rates it as R+8, a strongly republican seat, but slightly more moderate than the other three. Other methods that weight the 2016 election more heavily than 2012 will get a distinctly moderate district. At R+8, the actual result of Handel winning by 4 looks very good for Dems. At a more moderate R+2, it’s a bit of a disappointing result. While how you measure partisanship matters for GA-06, the crux of the point is that Democrats are achieving narrow defeats in areas where they should expect to be crushed. That is indicative of a very strong national environment for Dems.
OK, onto the simulation results. According to my model, in a general election that produces these four district results, Democrats should expect to take the House 87.4% of the time with a median of 242 seats. There is still quite a bit of uncertainty around these results, which should be unsurprising given that I’m trying to generalize from only four districts. In 1.1% of simulations, Republicans actually gained seats and the 95% credible interval ranges from 200 to 283 Democrats.
For those of you who read the earlier post, you’ll notice that all of those numbers are substantially better for Democrats than before the MT-AL race. The reason why is not that MT-AL, SC-05, or the GA-06 runoff were disproportionately good results for Democrats. In fact, they was just about in line with what happened in the earlier two races. GA-06 was a bit worse for Dems and SC-05 was a bit better. Instead, the change basically represents greater confidence in the predictions of the model. These are the sorts of outcomes that we would expect to see in a wave election, where Dems end up with a decent Congressional majority. The model is just a little cautious about predicting a wave from such sparse data. These are also the sorts of outcomes we would expect from the tails of the distribution in a slightly Republican year or a tsunami (what I am arbitrarily choosing to call a ridiculously strong wave election) Democratic year. As more elections come in, it becomes less likely that we’re drawing from the tail of the distribution and more likely that these results are representative.
One more comment about GA-06 and SC-05 just to hammer the point home. Democrats convinced themselves they could win in GA-06. They spent heavily there and focused national attention on one special election. Of the four races, so far, it was probably the most winnable for the Democrat, so in some sense the attention in reasonable. In another sense, it was always a long-shot. If you’re a college football fan and your team loses a week-one opener against Alabama in overtime, you’re totally justified feeling upset. You are not justified in giving up on the season. All this race tells us is that Democrats are not riding the sort of historic wave that would completely sweep out every Republican outside of the deep South. More to the point, a 4 point win by the Republican in GA-06 represents a 3.9 point shift towards Democrats from PVI. There are 227 House seats that are R+3.9 or less, meaning even if the Georgia result is more accurate than all the other special elections so far, Dems still have a good chance of taking the House. Also remember that, although it received a fraction of the coverage, there was also a race in South Carolina’s 5th yesterday. In a deeper red district, the Rep won by a smaller margin. **Turns to camera and speaks in Kevin Spacey voice** “Now if y’all’r expectin’ a House of Cards reference here, you had best look elsewhere.” Cersei Lannister is the far more interesting ruthless, conniving climber on prestige television right now. You get all the single-minded ambition plus frickin dragons. I’ll take my dystopian political dramas sword and sorcery style, thank you.
I promised some pretty graphs, and I will deliver at least on the graph part. I’ll leave the art criticism to you. First, a histogram of what the model thinks the national environment looks like in 2014, 2016, and based on these three special elections in 2017.

Next, a plot of quantiles of sampled elections given those sampled national environments. You can read this as basically what my model thinks the hypothetical 2017 general election looks like given these special election results. Each vertical line of 5 dots is one national environment sample. Each dot is the .05, .25, .5, .75, and .95 quantiles of election samples within that national environment.

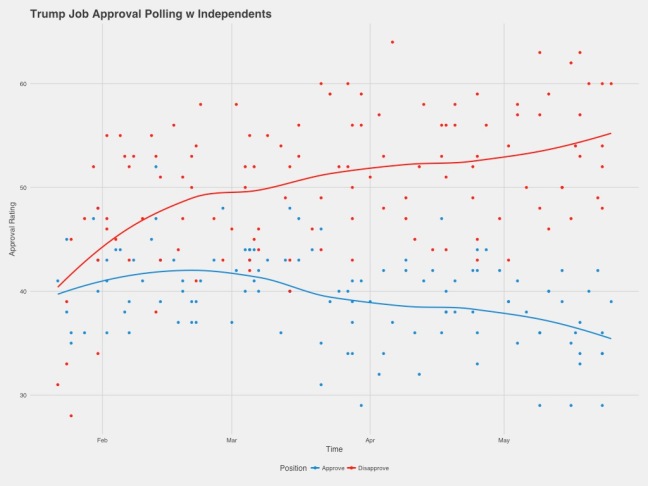
Insert standard disclaimer here. November 2018 is not June 2017. I have no idea what politics will look like in a year and a half. This is an analysis of a purely hypothetical election happening now. Also, for the record, none of this should be particularly surprising given other indicators of current politics. Donald Trump’s approval rating is abysmal. The generic Congressional ballot in polls shows a hefty Dem lead. Talk of an enthusiasm gap has started. I’ll leave legal comments to people who know more about the law, but it’s pretty hard to say that accusations of obstruction of justice and collusion with a foreign power are good for a party. Nor is support for wildly unpopular legislation dealing with healthcare. Plenty can happen between now and the election, but right now, Republican electoral prospects do not look great.
*One thing that goes into the error term here, that probably shouldn’t, is incumbency advantage. Take all my results here with a grain of salt, because my model considers all seats to be competitive on equal ground, as if they were open seats. In reality, Democrats might have to do even better nationally to have the sorts of gains predicted here, because the relevant seats they have to gain are currently held by Republican incumbents.
**The method I use here is a Markov-Chain Monte Carlo simulation implemented using the JAGS package in R, which sounds way more impressive than it is. Seriously, this is a super simple model that started as a class project. I just thought the results were interesting enough to post about.